In contrast to pure metals, which solidify at a constant temperature - freezing point, alloys solidify over a range of temperature, depending on the alloy components and their concentrations.
In course of solidification and subsequent cooling of solid alloy processes of phase transformations take place. The phases compositions and their quantities change with the temperature.
Phase diagrams are used for quantitative description of the phase transformation and changes.
Phase diagram of an alloy system is a graphical presentation of the relationships between the phases compositions and their relative amounts at any given temperature and under equilibrium conditions.
Despite the fact, that in real metallurgical processes, especially in the processes, occurring in solid state, the equilibrium conditions are not reached, phase diagram is a very useful instrument of analysis and quantitative evaluations of the alloy behavior.
Phase diagram of an alloy system consisting of two components is called binary phase diagram.
There are three main types of binary phase diagrams :
These three diagrams and combinations of them describe behavior of most of binary alloys.
Complete solid and liquid solution diagram
The typical diagram of this type is illustrated by the figure below.
The diagram has two curves – liquidus (equilibrium conditions of liquid phase with first solid crystals – primary crystals) and solidus (equilibrium conditions of last liquid with nearly complete solid).
Consider solidification of an alloy with concentration C. When the alloy temperature is higher than TL , single liquid phase exists (point M on the diagram).
When the temperature reaches the value TL (point M1 on the liquidus curve) solidification starts. According to solidus curve (point N1 )the first solid crystals have different composition – C1.
Further cooling of the alloy causes changing of the liquid phase composition according to the liquidus curve and when the alloy temperature reaches a certain intermediate value T (position MT ), liquid phase of composition Cy and solid phase of composition Cx are in equilibrium.
Relative amounts of the two phases are determined by their compositions and may be calculated by the “lever rule” :
WS / WL = MTY / MTX
or
WS / WL = (CY-C) / (C-CX)
Where:
WS – weight of the solid phase;
WL – weight of the liquid phase;
MTY and MTX – length of the corresponding lines in the diagram.
Solidification ends at the temperature TS and the last remainders of liquid phase have the composition C2 (according to the point F2 on the liquidus curve).
to top
Eutectic diagram
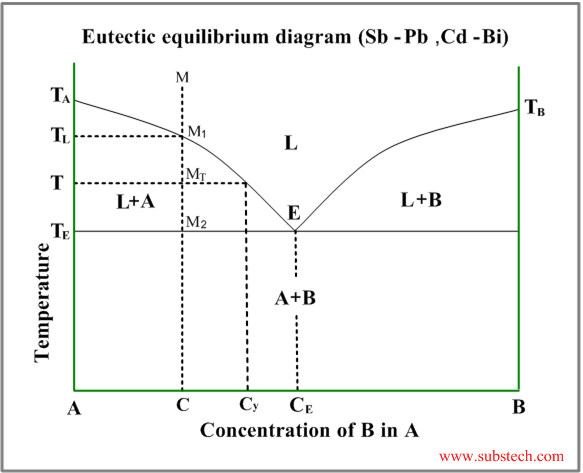
Eutectic phase diagram describes behavior of the alloys, two components of which are completely soluble in liquid state and entirely insoluble in solid state.
This diagram has two liquidus curves, starting from the freezing points of the two metals and intersecting in a minimum point – eutectic point.
Consider solidification of an alloy with concentration C. When the alloy temperature is higher than TL , single liquid phase exists (point M on the diagram).
When the temperature reaches the value TL (point M1 on the liquidus curve) solidification starts. The primary crystals, forming in this case are the crystals of the metal “A”.
Further cooling of the alloy causes enrichment of the liquid phase with the metal “B” according to the liquidus curve and when the alloy temperature reaches a certain intermediate value T (position MT ), liquid phase of composition Cy and solid phase, consisting of “A” crystals, are in equilibrium.
At the temperature equal to TE (eutectic temperature) formation of the primary crystals stops and the remainding liquid phase , having composition CE (eutectic composition), transforms to an intimate mixture of small “A” and “B” solid crystals. This is the eutectic phase transformation.
Relative amounts of the primary crystals and the eutectic mixture may be calculated by the “lever rule” :
WP / WE = (CE-C) / C
Where:
WP – weight of the primary crystals;
WE – weight of the eutectic mixture.
Eutectic diagram with partial solubility of the components in solid state
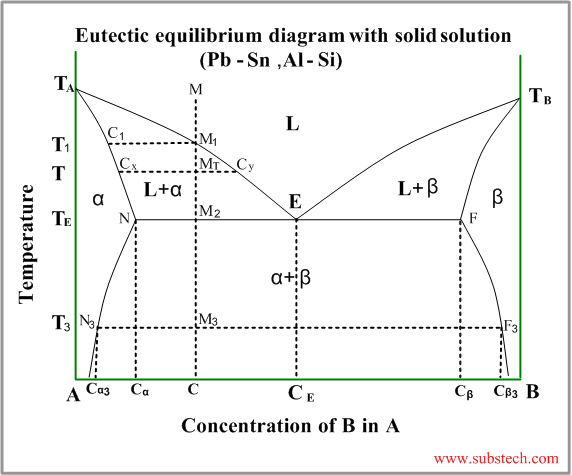
This kind of phase diagram is a “hybrid” ofthe diagram with complete solid and liquid solution and the eutectic diagram (the metals are completely soluble in liquid state and entirely insoluble in solid state).
Consider solidification of an alloy with concentration C. When the alloy temperature is higher than TL, single liquid phase exists (point M on the diagram).
When the temperature reaches the value TL (point M1 on the liquidus curve) solidification starts. According to solidus curve the first solid crystals (primary crystals) of the α-phase have composition C1.
Further cooling of the alloy causes changing of the liquid phase composition according to the liquidus curve and when the alloy temperature reaches a certain intermediate value T (position MT ), liquid phase of composition Cy and solid α-phase of composition Cx are in equilibrium.
At the temperature equal to TE (eutectic temperature) formation of the primary crystals stops and the remainding liquid phase , having composition CE (eutectic composition), transforms to a finely devided mixture of small solid crystals of α-phase and β-phase (eutectic phase transformation).
At this temperature all α-phase crystals have composition Cα and all crystals of β-phase have composition Cβ.
Relative amounts of the α-phase primary crystals and the eutectic mixture may be calculated by the “lever rule” :
WP / WE = M2E / M2N
or
WP / WE = (CE-C) / (C- Cα)
Where:
WP – weight of the α-phase primary crystals;
WE – weight of the eutectic mixture;
Just below the eutectic temperature TE the alloy consists of two solid phase: α-phase and β-phase, relative amounts of whichis determined by the “lever rule” :
Wα / Wβ = M2F / M2N
or
Wα / Wβ = (Cβ-C) / (C- Cα)
Where:
Wα – weight of the α-phase;
Wβ – weight of theβ-phase;
During further cooling solid solution phases (α-phase and β-phase) change their compositions according to the solvus curves NN3 and FF3 .
Solvus curve determins formation of solid solution phase from another solid solution phase – similar to liquidus curve.
At the temperature T3 α-phase crystals have composition Cα and all crystals of β-phase have composition Cβ.
Hypo-eutectic alloys
If an alloy composition C is lower, than eutectic composition CE , solidification of the alloy starts from formation of the primary crystals of α-phase according to the left branch of the liquidus curve. These alloys are called hypo-eutectic.
Hyper-eutectic alloys
If an alloy composition C is higher, than eutectic composition CE , solidification of the alloy starts from formation of the primary crystals of β-phase according to the right branch of the liquidus curve. These alloys are called hyper-eutectic.
Eutectoid phase transformation is analogous to the eutectic transformation, however it occurs with a solid solution phase, breaking up into a mixture of two finely divided phases of different compositions.
to top
Eutectic diagram with intermetallic compound
Intermetallic compound (valence compound) is a phase, having chemical composition equal to a fixed simple ratio, like CuZn,Cu3Sn, Mg2Pb, etc.
Sometimes intermetallic compounds exist over a range of composition, differing from the valence law. Intermetallic compounds of this sort are called electron compounds or intermediate solutions.
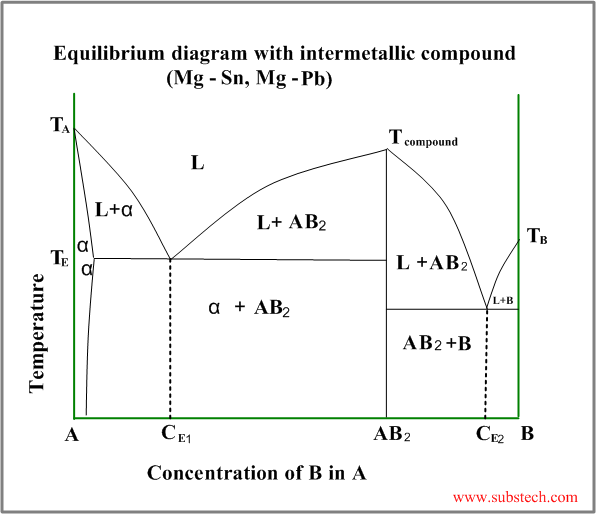
An example of a phase diagram with intermetallic compound AB2 is shown in the figure below.
This diagram may be considered as a combination two different diagrams: A- AB2 and AB2-B.
to top
Peritectic diagram
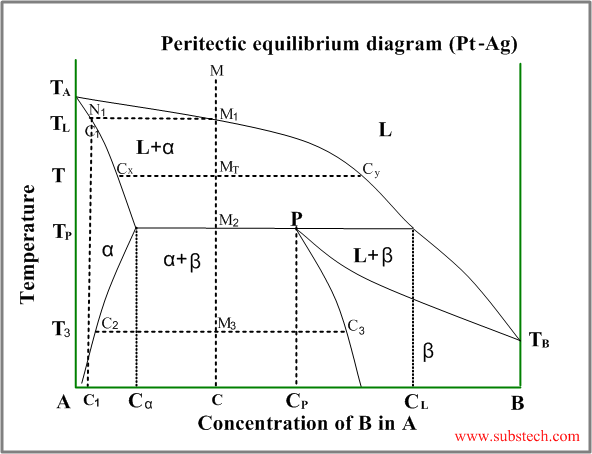
Sometimes a solid solution phase, which has already been formed, andthe residual liquid phase react and form another solid solution phase or intermetallic compound, having a composition between the compositions of the liquid and the first solid. This is peritectic transformation (peritectic reaction).
An example of a phase diagram with peritectic transformation is shown in the figure:
Consider solidification of an alloy with concentration C. When the alloy temperature is higher than TL , single liquid phase exists (point M on the diagram).
When the temperature reaches the value TL (point M1 on the liquidus curve) solidification starts. According to solidus curve (point N1 )the first solid crystals (primary crystals) of the α-phase have composition C1.
Further cooling of the alloy causes changing of the liquid phase composition according to the liquidus curve and when the alloy temperature reaches a certain intermediate value T (position MT ), liquid phase of composition Cy and solid α-phase of composition Cx are in equilibrium.
At the temperature equal to TP (peritectic temperature) formation of the α-phase crystals stops and the remainding liquid phase , having composition CL reacts with α-phase crystals , forming β-phase of composition CP (peritectic phase transformation).
At this temperature remaining α-phase crystals have composition Cα and all crystals of β-phase have composition CP (peritectic composition).
Relative amounts of the α-phase crystals and the liquid phase just above the peritectic transformation may be calculated by the “lever rule” :
Wα / WL = (CL-C) / (C- Cα)
Where:
Wα – weight of the α-phase crystals;
WL – weight of the liquid phase;
Just below the peritectic temperature TP the alloy consists of two solid phase: α-phase and β-phase, relative amounts of whichis determined by the “lever rule” :
Wα / Wβ = (CP-C) / (C- Cα)
Where:
Wα – weight of the α-phase;
Wβ – weight of theβ-phase;
During further cooling solid solution phases (α-phase andβ-phase) change their compositions according to the corresponding solvus curves.
At the temperature T3 α-phase crystals have composition Cα and all crystals of β-phase have composition Cβ.
If the alloy composition is exactly equal to peritectic composition CP , α-phase and liquid phase are consumed comletely in the peritectic reaction.
Alloys with composition C lower than CP , some quantity of α-phase remains after the peritectic reaction (it may be calculated by the “lever rule”).
If the alloy composition C is higher than CP , some liquid phase remains after the peritectic reaction. This remaining liquid transforms to β-phase during the further cooling.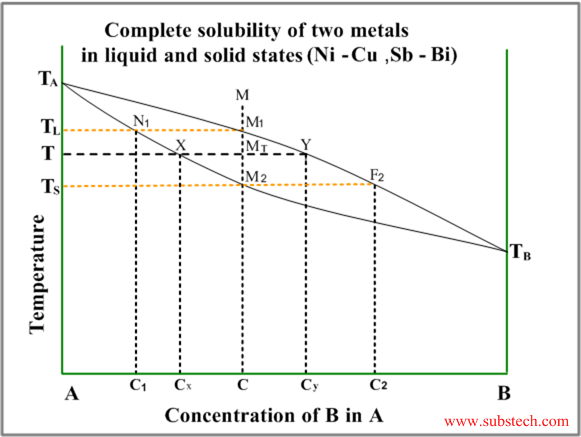

No comments:
Post a Comment